Data Visualization Articles
-

Key Performance Indicators
An article that discusses a concise methodology and best practices for collecting KPI’s and Metrics for your dashboard projects.
-

Dashboard Design – Part I
The first in a two part series focusing on dashboard design best practices.
-

Adobe Max 2009 – Advanced Data Visualization With Flex
This is the presentation Thomas Gonzalez was asked to give at the 2009 annual Adobe MAX corporate conference with over 5000 attendees.
-

360|Flex 2009 – Data Visualization and Dashboards
This is the presentation Thomas Gonzalez was asked to give at the 2009 360|Flex conference in San Jose, CA.
-

The Future of Business Intelligence
This article explores where BI is headed and postulates a thesis that the BI industry needs to adopt a new user-centric approach to building intelligent solutions.
-

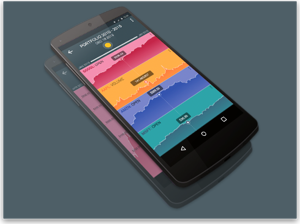
Mobile Data Visualization Design
Mobile devices represent new challenges for data visualization design. This article looks at new design approaches for mobile form factors.
-

Dashboard Design – Part II
The second in a two part series focusing on dashboard design best practices.
-

Adobe Max 2008 – Data Visualization With Flex
This is the presentation Thomas Gonzalez was asked to give at the 2008 annual Adobe MAX corporate conference with over 4000 attendees.
-

CF United 2009 – Axiis Open Source Data Visualization
In this presentation Thomas Gonzalez presents the Axiis open source data visualization framework that he co-authored and architected. Axiis broke new ground with its declarative/reaction based programming model and allowed an infinite variety of customization to data visualization on the Adobe Flex platform.


 POLITICAL INFLUENCE
 MOBILE FINANCE
 FEDERAL BUDGET