
 POLITICAL INFLUENCE
 FEDERAL BUDGET
Marketing Contributions
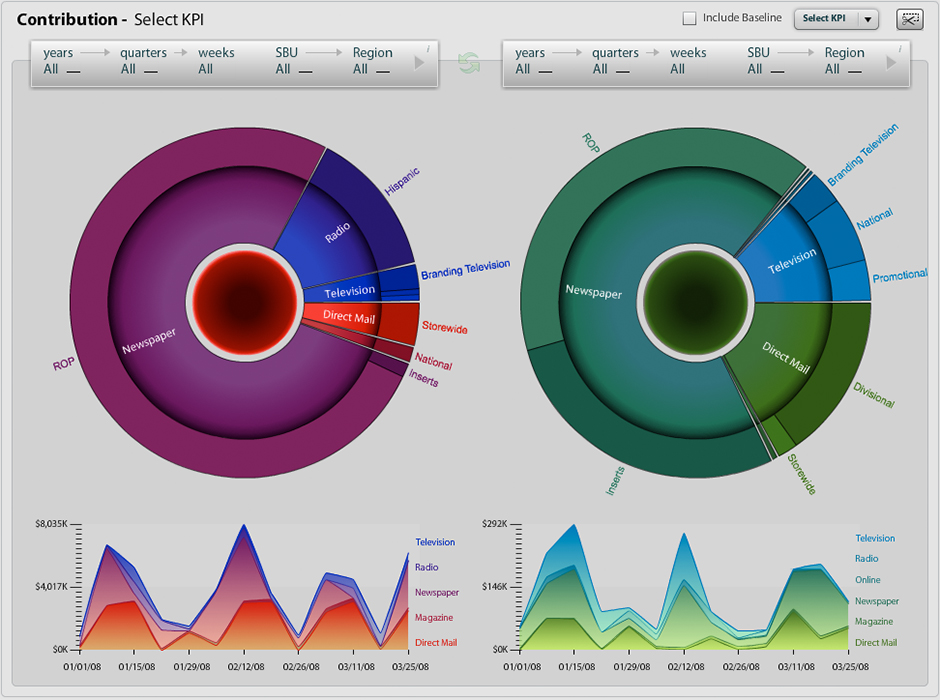
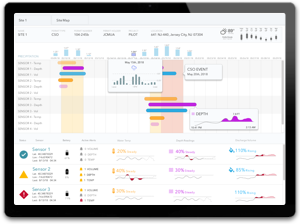
This example of an interactive client prototype was done with sample data and used to show the relationship between marketing campaigns across different media, dates, geographies, and time. The dimension selector at the top allows the user to select myriad permutations of various dimensions. This selector was designed and created by BrightPoint as an efficient and intuitive way to select multiple dimensions of large lists of data – a common task in marketing analytics.
The data itself is shown in a hierarchal sunburst diagram that allows the user to drill into sub-categories of spending. At the same time a time series is dynamically toggled beneath the selected dimensions to show spending over time by category. Two sets of these analytics are provided so users can compare one set of dimensions to another.
This visualization requires Adobe Flash.
[+] Click to Launch High Fidelity Project
zoom [+] Click to Launch High Fidelity Project
Comments