

 POLITICAL INFLUENCE
 FEDERAL BUDGET
NFL Predictions
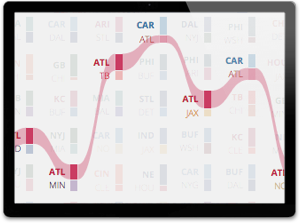
This Alluvial Diagram shows all 2015 NFL season games between teams on a week by week basis.
Each week of the season is represented by a column of stacked rectangle pairs, with each team being represented by their unique color. One pair of rectangles represents a single game, while each individual rectangle represents that team’s particular probability of winning that game as measured by the height of the (team) colored box. When you mouse over a particular team you will see details of that game as well as a colored link connecting all games for the season for that team.

This is awesome!
Thanks Alex!
Is there any chance, u could publish the code? I need to do a trend comparison by year in d3, i would hv a nice idea to get something out of this
[…] Source: http://www.brightpointinc.com/2015-nfl-predictions/ […]
Awesome!
Hi, I just wondering if also can add me to the mailing list for source code?
Amazing can you build this visual to MS Power BI custom visuals please. Thanks
Awesome Visual and Intelligent use of Alluvial/Sankey. We are looking to do something similar, is the code available yet? Thanks
Awesome AF!!!
Hey,
Are you Alex Kay who forecasts picks on Forbes.com?
[…] Predições NFL 2015 (Fonte) […]