
 POLITICAL INFLUENCE
 FEDERAL BUDGET
Data Visualization Services
Engineering
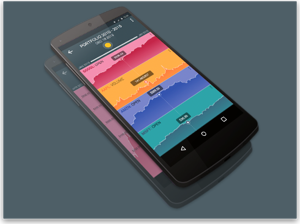
HTML5 and Mobile Solutions
For clients interested in engineering solutions that rely upon HTML5 for both desktop and mobile experiences we can help to architect, code, and test full production systems. With our own proprietary HTML5 software and industry standard data visualization software like D3.js we can engineer incredibly rich and deep data visualization solutions based on your design or ours.
Design
Its all about the story
A good data visualization is all about telling a story – visually. It involves not only understanding the data itself, but why it is important to a user. Defining a context for the data is the first step in the design process, understanding what meaning it imparts to a user, what insights a user will derive from a clearer picture. Adding interactivity to a visualization requires a deeper understanding of why the story is important to the user and what questions and exploration the user may want to do as a result of their initial insights.
At BrightPoint the design process starts with user interviews, analysis of the data, and mutually defining the context for the data. We then design wireframes (like pencil sketches) of a few different concepts to help get consensus on an approach. This is then followed up with rough mockups, and finally pixel perfect renderings that can be used as design guideline for a software development effort, or in some cases as a final product themselves.
Prototyping
Where the rubber meets the sky
The prototyping process involves taking a static data visualization design and creating an interactive prototype with sample data that can be used to vet the assumptions made in the design process and test different user interactions. Prototyping’s focus is to quickly create a testable design, not a production level engineering effort. We use whatever technology that will allow us to most expediently test and validate a design.
The resulting prototype can then be used as a functional specification for a more thorough engineering effort, or in some cases clients will use the prototype itself as a demo or sales asset.